
Want to know if QR codes are doing well for your Google marketing campaigns? With Google, you can use analytics to see how well the QR codes are doing. For example, it can tell you how many people are scanning your QR codes and the behavior that follows. You can even track these on social media and in emails. With that information, making decisions about advertising campaigns becomes a lot more informed.
QR-Codes And Google Analytics
Both QR codes and Google Analytics are useful tools for businesses wishing to reach customers and measure their marketing activities. Let’s examine these tools in more detail.
Setting Up Google Analytics
To start tracking QR codes effectively, you need to set up Google Analytics on your website. Here’s a simple guide to get you started:
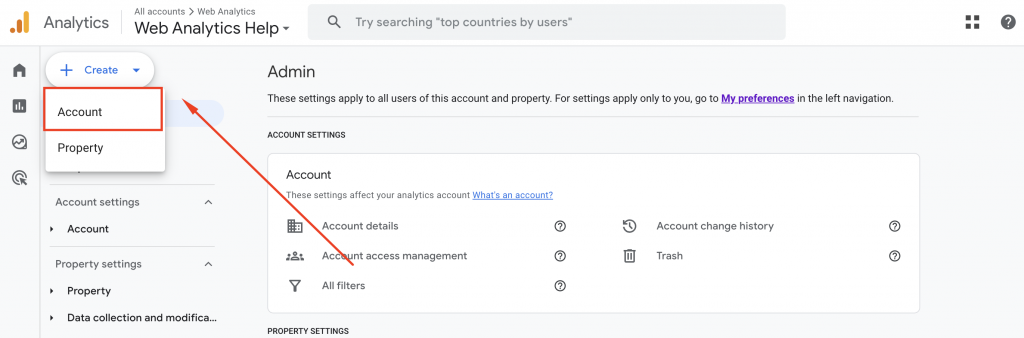
- Create A Google Analytics Account: The first step to getting started with Google Analytics is to sign up for one. If you do not already have a Google account, you will need to provide basic details about your website-that will be easiest if registered under your own name and URL.
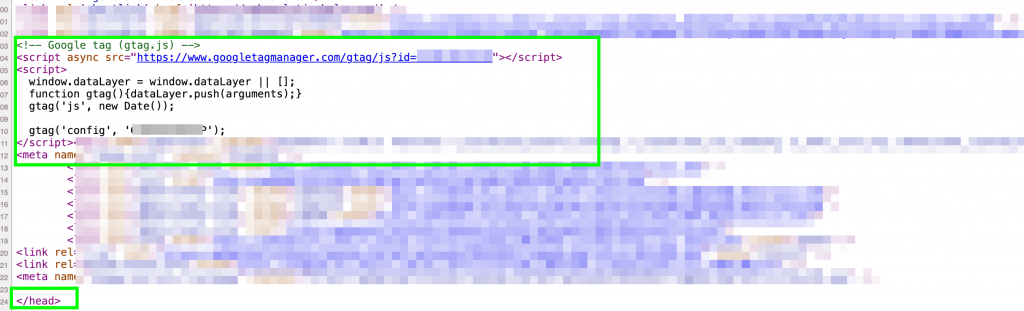
- Configure Your Tracking Code: Once you have your account set up, you will then need to Generate a Tracking Code for your website. This code is what allows Google Analytics to collect data about the visitors to your site and their behavior online.

- Paste The Tracking Code: Once you have the tracking code for your website or application, you can then insert this into its HTML or PHP file. You can now insert this code into the HTML or PHP file of your web site and its various pages. You should make sure the code is placed just before the closing </head> tag on every single page if accurate reporting in future by Google Analytics is to be obtained.
By following these steps, you can bring your QR code campaigns the vital information of total scans and user interactions, using Google Analytics.
QR Code Tracking with Google Analytics 4
There is a QR code tracking that will tell you which codes are frequented by visitors or users the most. For example, if you place an QR code on a product package, how can you know whether people are actually scanning it? This is where tools like Google Analytics and UTM parameters come into play.
Google Analytics 4 tracking for QR codes has several steps:
- Preparing The QR Code
- Add UTM parameters into the link used by the QR code.
- Shorten the URL using URL shorteners.
- Use this shortened address in generating QR Code
- Test the QR code to ensure it works well before using in marketing campaigns
- Lastly, run reports in Google Analytics how well our QR codes are doing.
Understanding QR Codes And UTM Parameters
Before going more into tracking QR code scans with Google Analytics, you should first understand the basics.
1. Preparing The QR Code
To make sure your QR code’s performance can be tracked accurately, you need to take a few steps beforehand. By default, standard analysis methods cannot detect the sources of this traffic that results from these two-dimensional barcode tracks. This is where UTM parameters come in. They can add more information for Google Analytics to understand where the traffic has come from and what it is being used on, including whether it’s a website of any kind, a Facebook page, a YouTube channel, or an Instagram profile.
2. Adding UTM Parameters To Your URL
Start by adding UTM parameters to your URL. For instance, let’s suppose that you want to get people to visit a landing page you have set up for some kind of special offer; such as example.com/special-offer. You’ll need to include at least three UTM parameters:
- utm_medium: This is a general description of what causes a QR code in your particular set-up, like print or billboard.
- utm_source: This describes in detail, such as the name of the magazine or billboard company that does this work for you.
- utm_campaign: Refers to the particular campaign connected with this QR code, for example, Summer Sale 2024.
After adding these individual parameters onto your URL, your URL will look something like this: https://example.com?utm_source=Facebook&utm_medium=Banner&utm_campaign=Summer20. Each parameter is linked by an ampersand (&).
You can use UTM Builder by Google.

3. Using A URL Shortener
Long URLs can occupy a lot of space in your QR code, affecting clarity or readability. Therefore, it is recommended to use a URL shortening service like bit.ly, tinyurl or shorturl.at. You simply putted the full version of your UTM in the shortener, and it spit out a condensed short url to use for your QR code.
4. Generating The QR Code
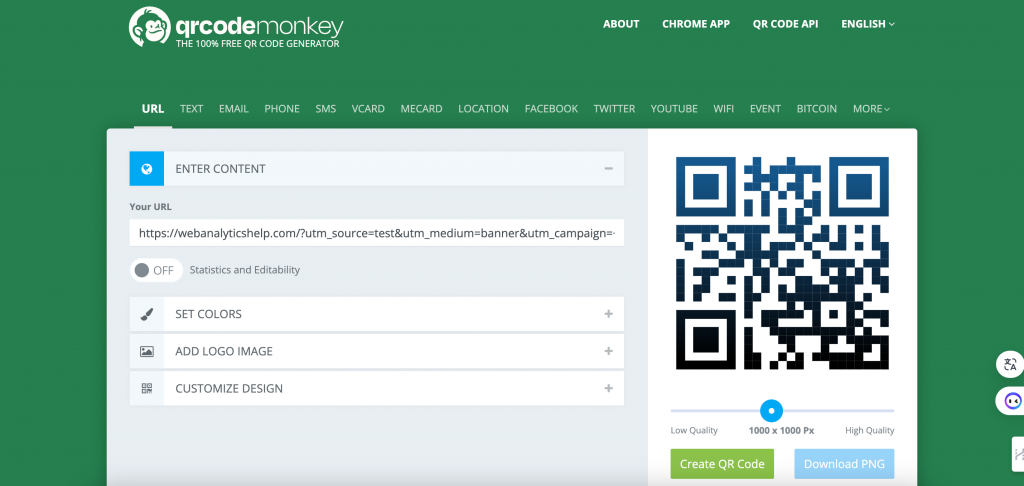
Now that you have a short URL, the next step is to create the QR code. There are many websites which allow you to make these easy to use graphics. Using https://www.qrcode-monkey.com/, for example, just enter the short URL on the form below and hit ‘Generate’.
Enter your URL in the ‘Your URL’ field, then click the ‘Create QR Code’ button.
Or you can generate in Chrome:

5. Testing Your QR Code
Before you go live with the QR code you’ve created on your marketing materials, you have to test it. You have to scan it with your iphone and make sure that anyone in the world standing in front of that print ad sees exactly what they should. Before you send it out, make sure to check your UTM data too — a good place to look is inside Google Analytics.
Once you’ve completed these steps, you’re ready to track your QR code scans effectively using Google Analytics and gain valuable insights into user behavior and engagement.
Where To Access QR Code Data In Google Analytics 4?
Once your QR code campaign is up and running, it’s important to know where to find the data in Google Analytics 4 (GA4). Here’s a step-by-step guide:
- Wait For Data Processing: After launching your campaign, be patient during the first 24 hours for GA4 to process the data. It might take some time for the traffic information to show up in your reports.
- Access Acquisition Reports: To view the reports for your QR code traffic sources, navigate to Reports > Acquisition > Traffic Acquisition. Make sure to select “Traffic Acquisition”. This report will feature the QR code traffic sources.
- Choose Session Medium Dimension: By default, the report displays Session Default Channel Grouping, which won’t show QR code-related data. Switch the primary dimension to Session Medium to start seeing the relevant information.
- Add Session Source Dimension: Click the plus icon to add a second dimension. Choose Session Sources to see the origin of QR Code scans and how they contributed toward other visits.
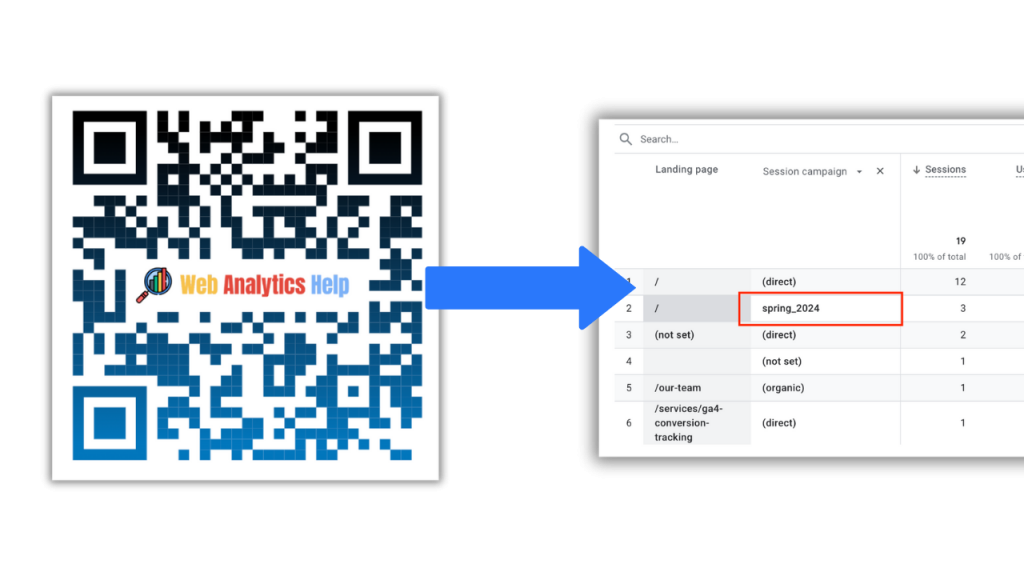
- Analyze Session Metrics: Now, you can see how many sessions and users came from people who scanned your QR code. Where applicable, you also check conversions and revenue, which gives an idea of how effective your QR code campaign has been.

By following these steps, you can effectively track and analyze the performance of your QR code campaigns in Google Analytics 4.
Frequently Asked Questions About QR codes And GA4
If you still have questions, here are some of the most frequently asked ones.
How Does Google Analytics Track QR Codes For Webpages?
There are several advantages in tracking QR codes through Google Analytics. It can give you deep insights into user behavior and conversion rates that are not available by traditional online media tracking offline to online conversion tracking. You can increase the effectiveness of your campaign measurement this way, and provide invaluable analytics for targeting strategies. Google Analytics also allows you to track real-time active users and page views, providing even more detailed insights into your visitors’ behavior and interests. This information can help you better understand your audience and make informed decisions about your marketing strategies.
What Are The Advantages Of Using QR Codes For Tracking Metrics In Google Analytics?
Using QR codes for tracking in Google Analytics offers several advantages, such as providing detailed insights into user behavior, tracking offline-to-online conversions, enhancing campaign performance measurement, and enabling targeted marketing strategies based on real-time data analytics.
Can QR Codes Be Customized For Better ROI Tracking And Analytics In Google Analytics?
Yes. QR codes can be customized by adding UTM parameters to track specific campaigns or sources in Google Analytics. For tracking and analysis this makes better insights into the actual performance of each QR code possible. This data helps businesses understand the effectiveness of their marketing efforts accurately.
How Can Businesses Benefit From Integrating QR Code Tracking Google Analytics App?
By integrating QR code tracking within the Google Analytics app, businesses can see what users do with codes after scanning. Of course, this information helps optimize campaigns; it also tracks conversions and helps understand customer engagement. It provides invaluable analytics for targeted marketing strategies and better ROI measurement.
What Are The Limitations Of QR Code Tracking In Google Analytics For ID Tracking?
Yes, there are limitations to using QR code tracking with Google Analytics. One limitation is that GA can only track the landing page after scanning the code and not the subsequent user actions within the page. This can restrict tracking of user behavior post initial interaction with the code.
How Can I Track The Performance Of My QR Code Campaigns?
To track your QR code campaigns effectively, you can use tools like Google Analytics. Start by creating a unique URL for each QR code using a URL builder tool. Then, monitor the data in Google Analytics by going to the “Acquisition” section and clicking on “Campaigns” to view your QR code campaign data. This will give you valuable insights into the effectiveness of your campaigns and help you make informed decisions for future marketing strategies. No programming experience is needed to set up tracking using Google Analytics.
What Metrics Should I Focus On When Analyzing QR Code Data?
If you want to efficiently track the effect of QR code campaigns, you can use tools like Google Analytics. using a URL builder tool to create a unique URL for each QR code. Monitor, in Google Analytics, the data of these codes by going to the ‘Acquisition’ tab and click ‘Campaigns’. From there, you can get valuable insights into how well those campaigns worked or didn’t went well–which will help you make future decisions about marketing strategy informed by actual results instead of just guesswork. No programming experience is needed to set up these metrics in Google Analytics.
Can I Use QR Codes On Business Cards To Track Customer Behavior?
Remember, you could use QR codes on the business cards to follow customer behavior. If a QR code is placed on your visiting card and linked to a unique URL, measurements such as total scans or user interactions can be tracked. This is information that lets you monitor how people who receive your visiting cards are engaging with what you put in their hands—value that can shed some light on user behavior and preferences.
Contact Us
Would you like to get started with Google Analytics 4 for tracking QR code campaigns? With us, you can learn about the behavior of your audience, how users are engaging with your product, and the overall effectiveness of your marketing efforts. Reach out to us for personalized assistance. We are here to help you make your QR code campaign score its highest ratings ever! Contact us if you need help with web analytics tracking.