
In Google Analytics 4, conversion rate is a primary metric which measures the number of users who complete a particular action against the total number of visits. It acts as a report for your website or app’s effort in getting people to do what you want them to do – be it making purchases, signing up for newsletters or filling out forms. Conversion rates show us what works and what doesn’t; whether from Google Ads or other search engines. This enables businesses make better decisions on how they can enhance user experience hence achieve more success online through adding new metrics into their reports.
What’s the Difference between GA4 Conversion (Key Event) and Conversion Rate (Key Event Rate)?
GA4 conversion varies in its focus and measurement from conversion rate. In GA4, conversion indicates any activity that a user may want to accomplish like buying or filling out a form.
From now:
GA4 Conversion called Key Event
Conversion Rate called Key Event Rate
Conversion rate on the other hand measures what percentage of users who complete a specific action out of all sessions recorded. Conversion reflects individual actions while conversion rate shows wider view of efficiency by considering user engagement per session. For example, a purchase made through Google Ads can be treated as the event but then how many such purchases occurred relative to total number of sessions from all traffic sources would be indicated by conversion rate. Knowing this difference is essential for optimizing strategies and gaining insights into user behavior as well as website performance.
How to Track CT in GA4
Discover how to track Click-to-Call (CTC) events in Google Analytics 4 (GA4) using Google Tag Manager (GTM). Follow these steps to see how people interact with your website and improve your chances of turning visitors into customers.
Set Up GTM Variables
GTM uses variables to hold values when certain actions happen on your site. To set up variables:
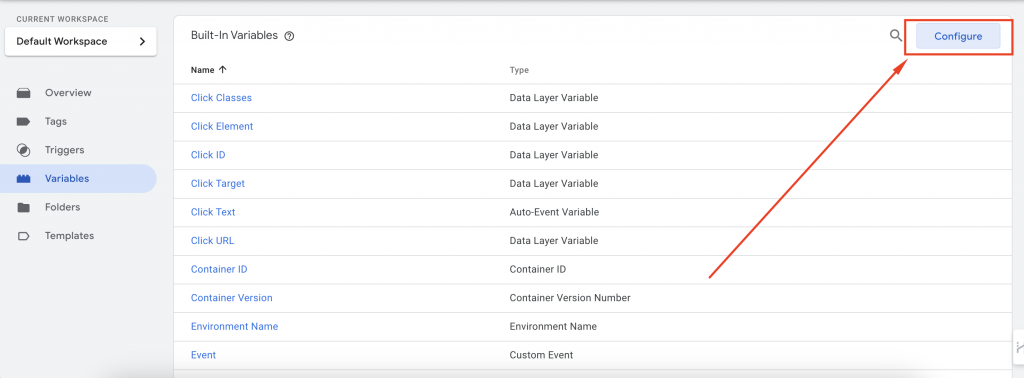
- Go to the Variables tab in GTM.
- Click Configure under built-in variables.
- Make sure all checkboxes under Clicks are checked.
Create a CTC Trigger
Let’s set up a trigger to track when users click to call:
- Find the event name:
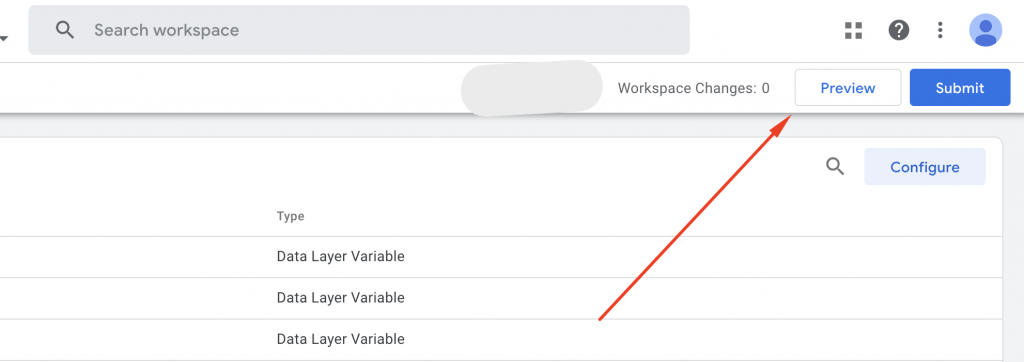
- Use GTM’s Preview mode.
- Click your phone number or icon.
- In the debug mode, you’ll see an event name (e.g., {event: “gtm.linkClick”, …}) when the call action happens.

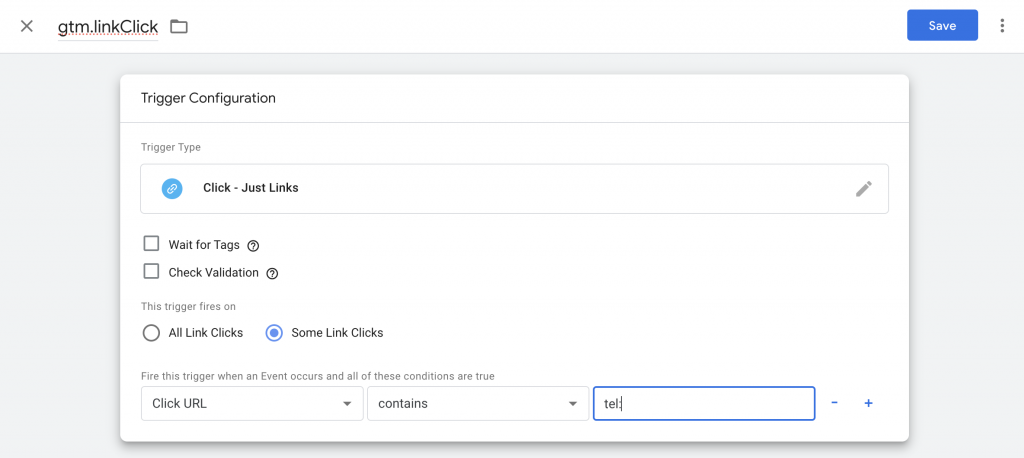
Set up the trigger
- Go to Triggers + New in GTM.
- Name your trigger (e.g., ‘Click to Call’).
- Configure it to fire when:
- Event name is gtm.linkClick.
- Click URL contains tel: (common for CTC).
Set up the tags
- Go to Tags + New in GTM.
- Name your tags (e.g., ‘Click to Call’).
- Configure it to fire when
- Event name is gtm.linkClick.
- Click URL contains tel: (common for CTC).
- Add Trigger

Testing and Publishing
- Preview to test the trigger.
- Once satisfied, publish the changes in GTM.
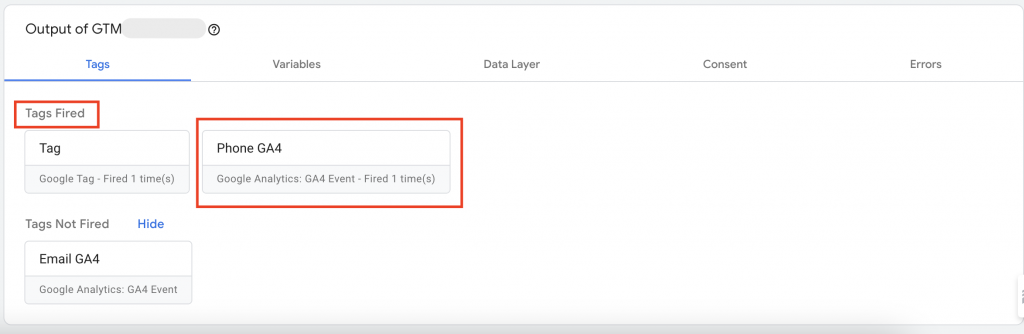
By doing this, you’ll track CTC events and understand how users engage with your business, enhancing user experience and potentially boosting conversions. This seamless connection with your audience is vital in today’s digital landscape.
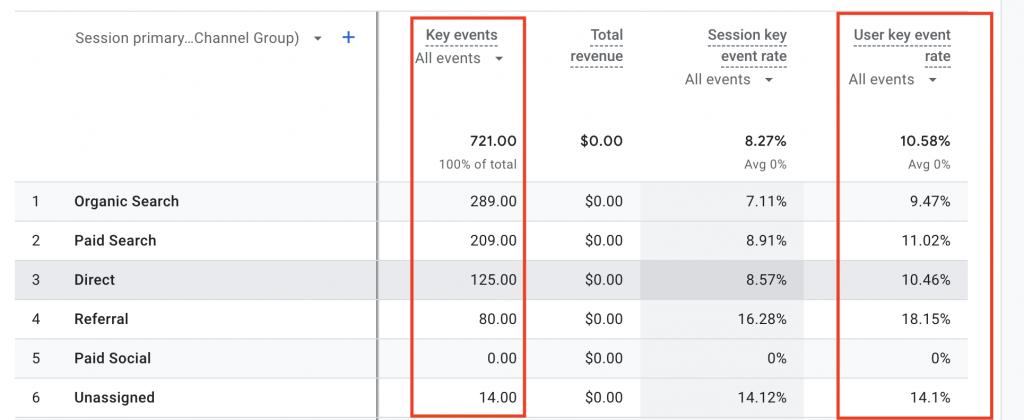
Two Types of Conversion Rate in Google Analytics 4
In Google Analytics 4 (GA4), there are two main types of conversion rates: session conversion rate and user conversion rate.
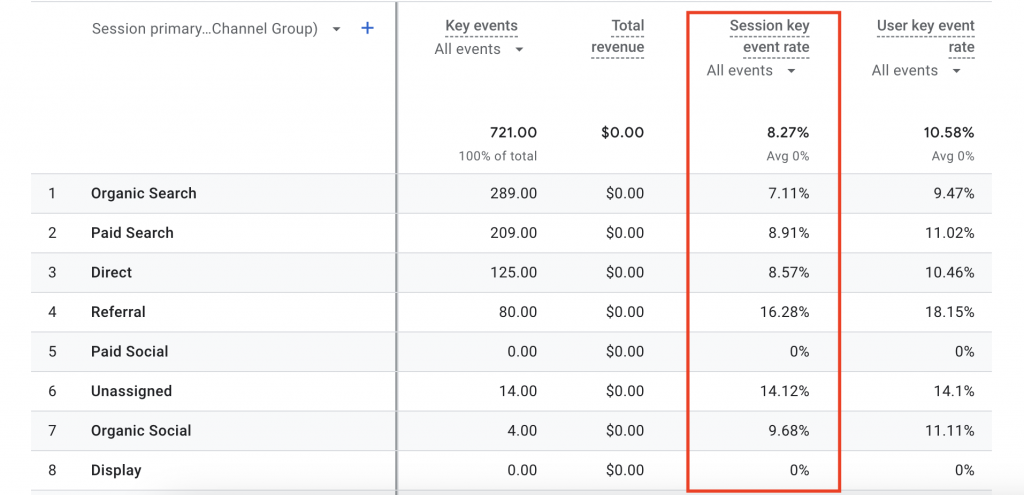
Session Conversion Rate
Frequency is represented by this measure of how often a particular action is done in relation to the number of visits made by users on your site. It could be purchasing a product or filling out a form. This information enables us to know which parts of our website encourage visitors or clients to take further actions like buying goods or signing up for newsletters and more. By cross-examining conversion rates per session with indicators such as source/medium data (where people came from), pages per session, average session duration among others; we are able to identify those areas that attract most engaged customers/prospects as well as parts having highest conversion rates due to different features used.
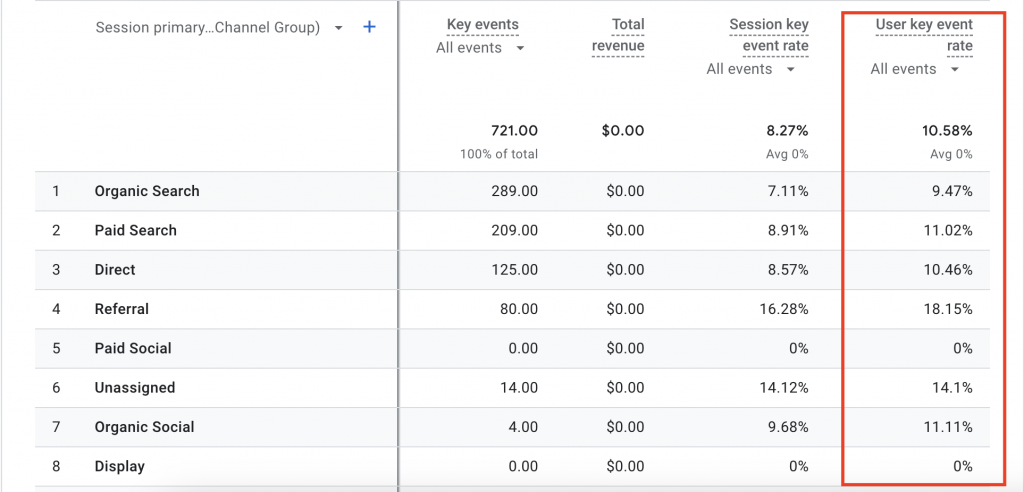
User Conversion Rate
Apart from tracking conversions through individual sessions, another useful metric would be the user conversion rate. This figure gives us an idea about what percentage out of all the people who visit our site end up completing some desired goals overtime i.e., not just once but over multiple visits too. The user conversion percentage ratio tells us about how good/badly our website does at converting its users into customers in general and long-term basis especially when coupled with other statistics like total number of users, number of conversions etcetera hence enabling one notice any shifts or changes in behavior among them which may call for adjustments in marketing strategies too. For instance, we can realize that some guests have higher conversion rates from a certain channel or demographic group, this means we have to concentrate on such audience for increased conversions. Comparing user and session conversion rates enables us to optimize our website’s performance as well as increase conversion numbers.
When using Google Analytics 4, it is important for companies to consider both the session conversion rate and the user conversion rate because they give insights about the site’s performance and also help in making decisions which will lead into better results of conversion. This is only possible if business owners know what these two terms mean; otherwise, there might be confusion when interpreting data.
What are session conversion rates?
In Google Analytics, session conversion rate refers to the percentage of visits during which users completed a desired action. It could be anything from making a purchase to filling out a contact form within one browsing session. This metric helps marketers understand how people interact with their sites and where they need improvement on marketing campaigns that have low success rates. Additionally, it measures efficiency at different stages in your sales funnel – so if you’re seeing high drop-off rates after users land on specific pages (like checkout), this could indicate an issue with those particular areas not being compelling enough for visitors to move forward. Therefore businesses should analyze session source along other factors like user interactions & specific events leading up-to conversions so that they can come up with strategies that will improve their tracking efforts while achieving more sessions converted but businesses should avoid double-counting sessions that lasted less than three seconds
Analyzing User Conversion Rates
Analyzing user conversion rates involves examining the percentage of total users who complete desired actions, such as making a purchase or signing up for a service, within a specified time frame. This process provides insights into the effectiveness of marketing efforts and website performance in converting visitors into customers. By leveraging data from Google Analytics account, businesses can track user conversion rates over time and identify trends in user behavior. Analyzing user conversion rates alongside metrics like organic search traffic, ecommerce conversion rate, and conversion data helps businesses optimize their traffic acquisition strategies and improve overall conversion performance.
GA4 Conversion Rate Reports
Here are the steps to calculate your conversion rate in Google Analytics 4:
- Start by creating a new report in Google Data Studio and connecting your GA4 data source.
- Once your data source is connected, add a scorecard to your report and change the metric to ‘Conversions’.
- By default, this will display the total number of conversions. However, if you want to focus on a specific conversion action, you can add a filter. To do this, head to the ‘Conversions’ report in Google Analytics to identify the available conversion events.
- If the desired conversion action is not available, you’ll need to set it up first. Watch tutorials or guides on Google Analytics 4 Conversion Tracking for assistance.
- For example, if you want to calculate the conversion rate using the ‘begin_checkout’ action, add a filter in Google Data Studio for this specific conversion action.
- Once the filter is applied, you’ll see the total number of conversions for the selected action.
- Next, add another scorecard to the report and change the metric to either ‘Sessions’ or ‘Total Users’, depending on whether you want to calculate a session-based or user-based conversion rate.
- Combine the two metrics to calculate your conversion rate by selecting both scorecards, right-clicking, and selecting ‘Blend Data’.
- A new scorecard displaying your conversion rate will be added to the report.
- That’s it! You’ve successfully calculated the conversion rate using data from Google Analytics 4 with the help of Google Data Studio.
How can conversion rate metrics can optimize your online business?
To upgrade your online business, it is essential to utilize metrics for conversion rate. For example session conversion rates, ecommerce conversion rates, and tools such as Google Analytics can be used to measure conversion. This enables you to realize the way in which individuals are using your site. You will be able to recognize where visitors come from like search engines among others and what actions bring about purchase thus enabling you concentrate on what works best.
By tracking how many people visit your site and how many of them take action, you can know if your marketing strategy is effective or not and also determine the ease of use of your website. Sometimes even small changes like improving page titles or making forms easier to fill out may lead to more sales on the website because more people will buy things there. Therefore efforts should be directed towards conversion rate optimization so that they count and yield better results for an online business.
Conversion rate for e-commerce
Recent research has shown that simple changes to an e-commerce site design can significantly improve sales by increasing the conversion rate. Just a 1% increase in this indicator means much more money in your pocket. Most e-commerce sites have a conversion rate of between 2% and 4%, but some top performers achieve 5% or even higher.
The findings indicate that where you get your website traffic from makes a difference; people who arrive at your site through organic searches are likelier to make purchases than those coming from ads or social media platforms. Additionally, certain actions on your website often lead to more transactions such as adding items into the shopping cart or completing checkout process.
To increase e-commerce conversion rates on your online store make small adjustments like improving page titles, streamlining checkouts, and refining product descriptions for clarity. With tools such as Google Analytics which helps track user behaviour so that informed decisions can be made towards bettering performance leading not only to increased sales but also improved return on investment (ROI).
Summary
The guide gives useful advice on how to improve conversion rates using Google Analytics 4 (GA4). It shows ways of monitoring various conversions such as Click-to-Call events through Google Tag Manager. With session and user conversion rates, enterprises can evaluate their website performance and enhance user interactions. Businesses need to understand these conversion rate indicators especially event conversion rates so that they can gain insights for decision making towards bettering their online visibility which in turn leads into more conversions.